The Beginner’s Guide to Data Science Experimental Design:
Now that we’ve looked
at the different types of data science questions, we are going to spend some
time looking at experimental design concepts, in our last lesson of our first Course "The Data Science Toolbox" in our Data Science Specialization using R Programming. As a data scientist, you are
a scientist and as such, need to have the ability to design
proper experiments to best answer your data science questions!
What does experimental design mean?
Experimental design is
organizing an experiment so that you have the correct data (and enough of it!)
to clearly and effectively answer your data science question. This process
involves clearly formulating your question in advance of any data collection,
designing the best set-up possible to gather the data to answer your question,
identifying problems or sources of error in your design, and only then,
collecting the appropriate data.
Why should you care?
Going into an
analysis, you need to have a plan in advance of what you are going to do and
how you are going to analyze the data. If you do the wrong analysis, you can
come to the wrong conclusions!
We’ve seen many
examples of this exact scenario play out in the scientific community over the
years - there’s an entire website, Retraction Watch, dedicated to identifying papers that have
been retracted, or removed from the literature, as a result of poor scientific
practices. And sometimes, those poor practices are a result of poor
experimental design and analysis.
Occasionally, these
erroneous conclusions can have sweeping effects; particularly in the field of
human health.
For example, here we have a paper that was trying to predict the effects of
a person’s genome on their response to different chemotherapies, to guide which
patient receives which drugs to best treat their cancer. As you can see, this
paper was retracted, over 4 years after it was initially published. In that
time, this data, which was later shown to have numerous problems in their
set-up and cleaning, was cited in nearly 450 other papers that may have used
these erroneous results to bolster their own research plans. On top of this,
this wrongly analyzed data was used in clinical trials to determine cancer
patient treatment plans. When the stakes are this high, experimental design is
paramount.

Principles of experimental design
There are a lot of
concepts and terms inherent to experimental design. Let’s go over some of these
now!
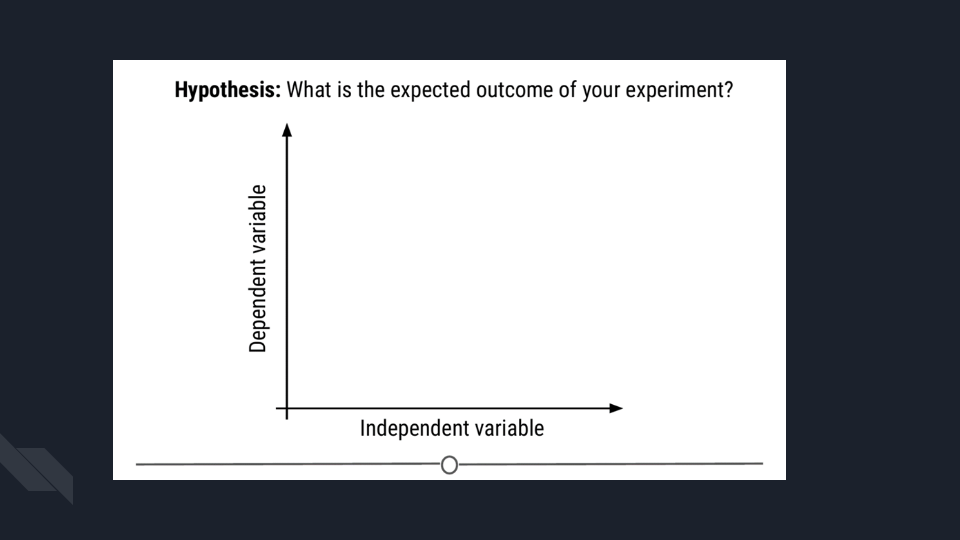
Independent variable
(AKA factor): The variable
that the experimenter manipulates; it does not depend on other variables being
measured. Often displayed on the x-axis.
Dependent variable: The variable that is expected to change
as a result of changes in the independent variable. Often displayed on the
y-axis, so that changes in X, the independent variable, effect changes in Y.
So, when you are
designing an experiment, you have to decide what variables you will measure,
and which you will manipulate to effect changes in other measured variables.
Additionally, you must develop your hypothesis, essentially an
educated guess as to the relationship between your variables and the outcome of
your experiment.
Let’s do an example
experiment now! Let’s say for example that I have a hypothesis that as shoe
size increases, literacy also increases. In this case, designing my experiment,
I would choose a measure of literacy (e.g.: reading fluency) as my variable
that depends on an individual’s shoe size.

To answer this
question, I will design an experiment in which I measure the shoe size and
literacy level of 100 individuals. Sample size is the number
of experimental subjects you will include in your experiment. There are ways to
pick an optimal sample size, that you will cover in later courses. Before I
collect my data though, I need to consider if there are problems with this
experiment that might cause an erroneous result. In this case, my experiment
may be fatally flawed by a confounder.
Confounder: An extraneous variable that may affect
the relationship between the dependent and independent variables.
In our example, since
age affects foot size and literacy is affected by age, if we see any
relationship between shoe size and literacy, the relationship may actually be
due to age – age is “confounding” our experimental design!
To control for
this, we can make sure we also measure the age of each individual so that we
can take into account the effects of age on literacy, as well. Another way we could control for
age’s effect on literacy would be to fix the age of all
participants. If everyone we study is the same age, then we have removed the
possible effect of age on literacy.

In other experimental
design paradigms, a control group may be appropriate. This is
when you have a group of experimental subjects that are not manipulated.
So if you were studying the effect of a drug on survival, you would have a
group that received the drug (treatment) and a group that did not (control).
This way, you can compare the effects of the drug in the treatment versus
control group.

In these study
designs, there are other strategies we can use to control for confounding
effects. One, we can blind the subjects to their assigned
treatment group. Sometimes, when a subject knows that they are in the treatment
group (e.g.: receiving the experimental drug), they can feel better, not from the
drug itself, but from knowing they are receiving treatment. This is known as
the placebo effect. To combat this, often participants are blinded
to the treatment group they are in; this is usually achieved by giving the
control group a mock treatment (e.g.: given a sugar pill they are told is the
drug). In this way, if the placebo effect is causing a problem with your
experiment, both groups should experience it equally.

And this strategy is
at the heart of many of these studies; spreading any possible confounding
effects equally across the groups being compared. For example, if you think age
is a possible confounding effect, making sure that both groups have similar
ages and age ranges will help to mitigate any effect age may be having on your
dependent variable - the effect of age is equal between your two groups.
This “balancing” of
confounders is often achieved by randomization. Generally, we don’t
know what will be a confounder beforehand; to help lessen the risk of
accidentally biasing one group to be enriched for a confounder, you can
randomly assign individuals to each of your groups. This means that any
potential confounding variables should be distributed between each group
roughly equally, to help eliminate/reduce systematic errors.
 Randomizing subjects
to either the control or treatment group is a great strategy to reduce
confounders’ effects
Randomizing subjects
to either the control or treatment group is a great strategy to reduce
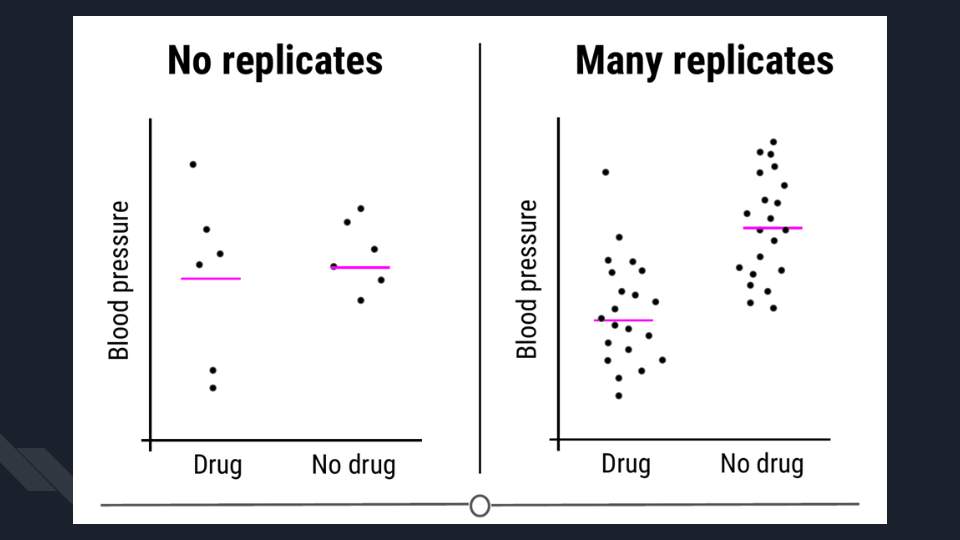
confounders’ effectsThere is one final
concept of experimental design that we need to cover in this lesson, and that
is replication. Replication is pretty much what it sounds like,
repeating an experiment with different experimental subjects. A single
experiment’s results may have occurred by chance; a confounder was unevenly
distributed across your groups, there was a systematic error in the data
collection, there were some outliers, etc. However, if you can repeat the
experiment and collect a whole new set of data and still come
to the same conclusion, your study is much stronger. Also at the heart of
replication is that it allows you to measure the variability of
your data more accurately, which allows you to better assess whether any
differences you see in your data are significant.
Sharing data
Once you’ve collected
and analyzed your data, one of the next steps of being a good citizen scientist
is to share your data and code for analysis. Now that you have a GitHub account
and we’ve shown you how to keep your version controlled data and analyses on
GitHub, this is a great place to share your code!
In fact, hosted on
GitHub, the Leek group, has developed a guide that has great advice
for how to best share data! Check it out.
Beware p-hacking!
One of the many things
often reported in experiments is a value called the p-value. This
is a value that tells you the probability that the results of your experiment
were observed by chance. This is a very important concept in statistics that we
will be covering in depth in our Statistical Inference course, if you want to
know more, check out this video explaining more about p-values.
What you need to look
out for is when you manipulate p-values towards your own end. Often, when your
p-value is less than 0.05 (in other words, there is a 5 percent chance that the
differences you saw were observed by chance), a result is considered significant. But if you do 20 tests, by chance, you would
expect one of the twenty (5%) to be significant. In the age of big data,
testing twenty hypotheses is a very easy proposition. And this is where the
term p-hacking comes from: This is when you exhaustively search a data
set to find patterns and correlations that appear statistically significant by
virtue of the sheer number of tests you have performed. These spurious
correlations can be reported as significant and if you perform enough tests,
you can find a data set and analysis that will show you what you wanted to see.
Check out this FiveThirtyEight activity where you can manipulate and
filter data and perform a series of tests such that you can get the data to
find whatever relationship you want! Check it out.

XKCD mocks this concept in a comic testing
the link between jelly beans and acne - clearly there is no link there, but if
you test enough jelly bean colors, eventually, one of them will be correlated
with acne at p-value < 0.05!

Summary
In this lesson we covered what experimental design is and why good experimental design matters. We then looked in depth to the principles of experimental design and defined some of the common terms you need to consider when designing an experiment. Next, we detoured a bit to see how you should share your data and code for analysis. And finally, we looked at the dangers of p-hacking and manipulating data to achieve significance.
Comments
Post a Comment
Type your comment here.
However, Comments for this blog are held for moderation before they are published to blog.
Thanks!